Revisiting Channel Effectiveness: A Multi-Dimensional Evaluation with Primitive Visual Stimuli
Soohyun Lee (Seoul National University), Seokhyeon Park (Seoul National University), Minsuk Chang (Georgia Institute of Technology), Jinwook Seo (Seoul National University)

Jump to Discussion
Presentation
- Session
- Did you see that? Are you sure?
- Time
- Wednesday, Nov 11, 13:12 – 13:24 (US/Eastern) · session 13:00 – 14:30
- Room
- Hall Essex center
- Presenting from
- Boston
Links
Sign in to access the Paper PDF.
- Preprint PDF(opens in new tab)
Abstract
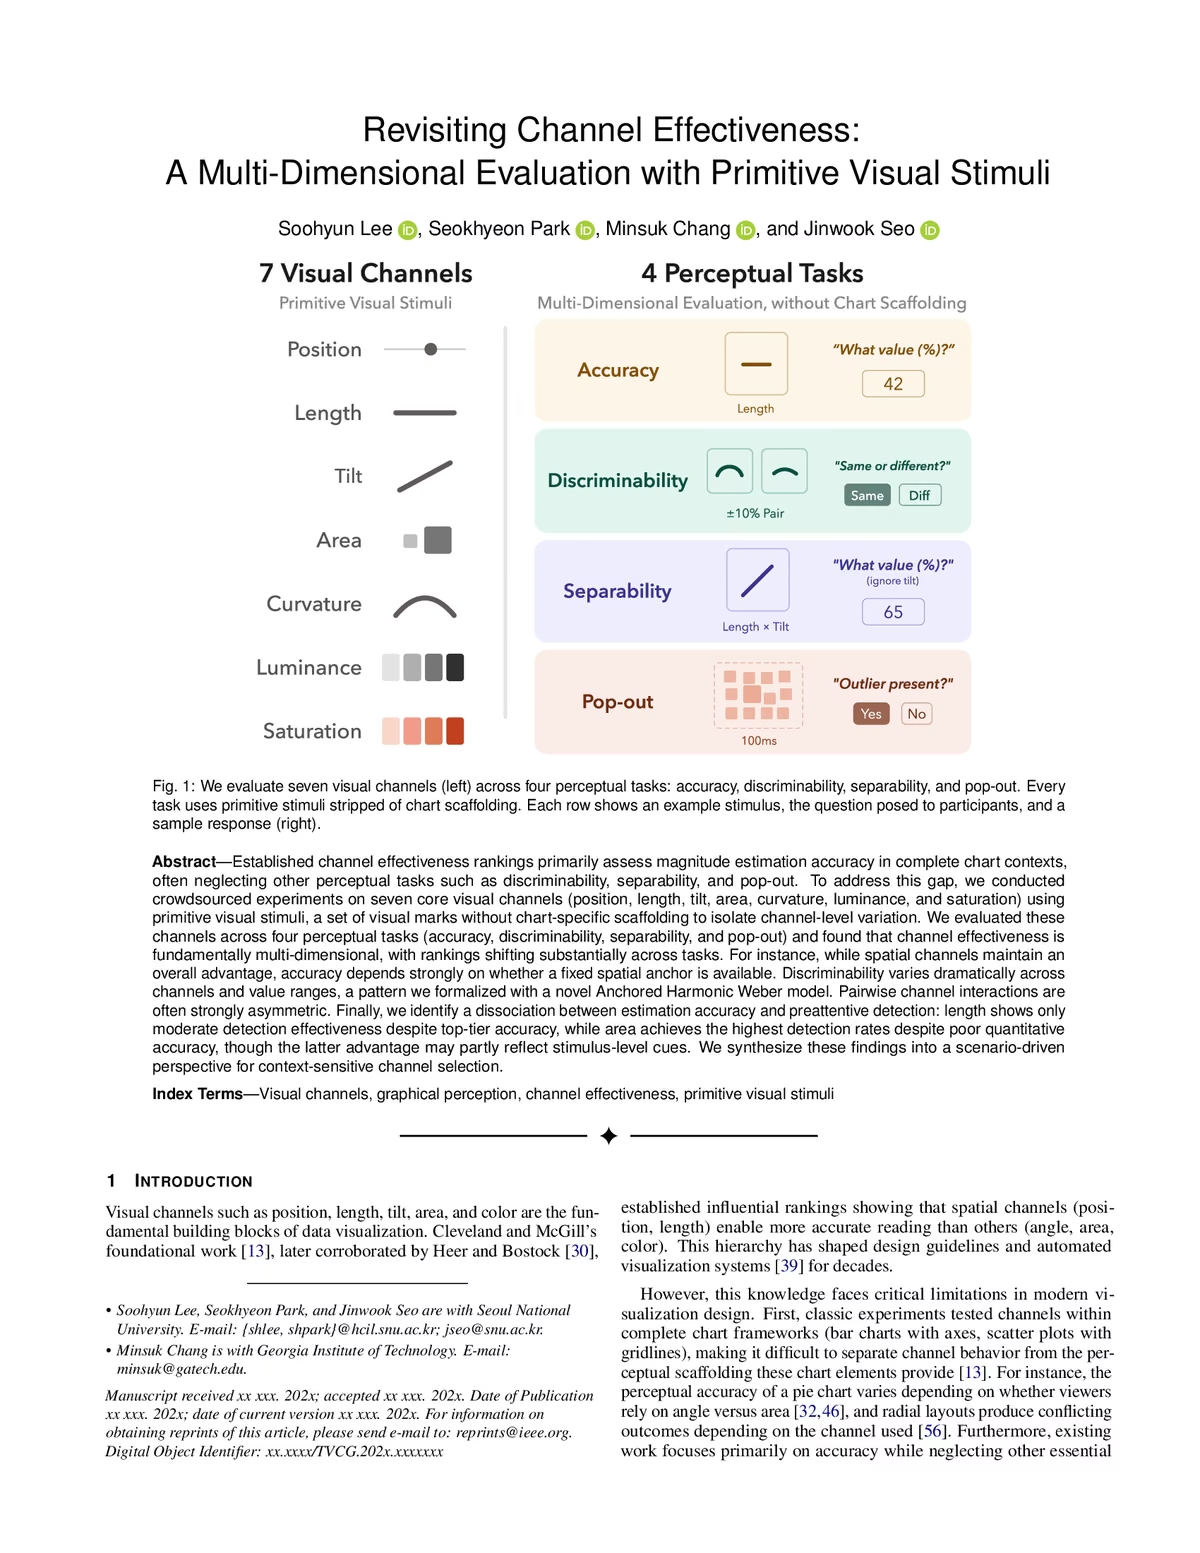
Established channel effectiveness rankings primarily assess magnitude estimation accuracy in complete chart contexts, often neglecting other perceptual tasks such as discriminability, separability, and pop-out. To address this gap, we conducted crowdsourced experiments on seven core visual channels (position, length, tilt, area, curvature, luminance, and saturation) using primitive visual stimuli, a set of visual marks without chart-specific scaffolding to isolate channel-level variation. We evaluated these channels across four perceptual tasks (accuracy, discriminability, separability, and pop-out) and found that channel effectiveness is fundamentally multi-dimensional, with rankings shifting substantially across tasks. For instance, while spatial channels maintain an overall advantage, accuracy depends strongly on whether a fixed spatial anchor is available. Discriminability varies dramatically across channels and value ranges, a pattern we formalized with a novel Anchored Harmonic Weber model. Pairwise channel interactions are often strongly asymmetric. Finally, we identify a dissociation between estimation accuracy and preattentive detection: length shows only moderate detection effectiveness despite top-tier accuracy, while area achieves the highest detection rates despite poor quantitative accuracy, though the latter advantage may partly reflect stimulus-level cues. We synthesize these findings into a scenario-driven perspective for context-sensitive channel selection.
For Practitioners
Anyone who creates charts - visualization designers, dashboard and BI tool builders, data journalists, and scientists or analysts preparing figures. Our per-task channel rankings and scenario dimensions (task stakes, granularity, interference, response time) help them choose encodings that match how their charts are actually read.