BLIMMP-Explorer: A Visual Decomposition of Bayesian Evidence in Metabolic Module Inference
Jump to Discussion
Presentation
- Session
- Connecting the Dots
- Time
- Wednesday, Nov 11, 13:00 – 13:09 (US/Eastern) · session 13:00 – 14:30
- Room
- Hall Essex north
Links
Sign in to access the Paper PDF.
- Supplemental Material(opens in new tab)
Abstract
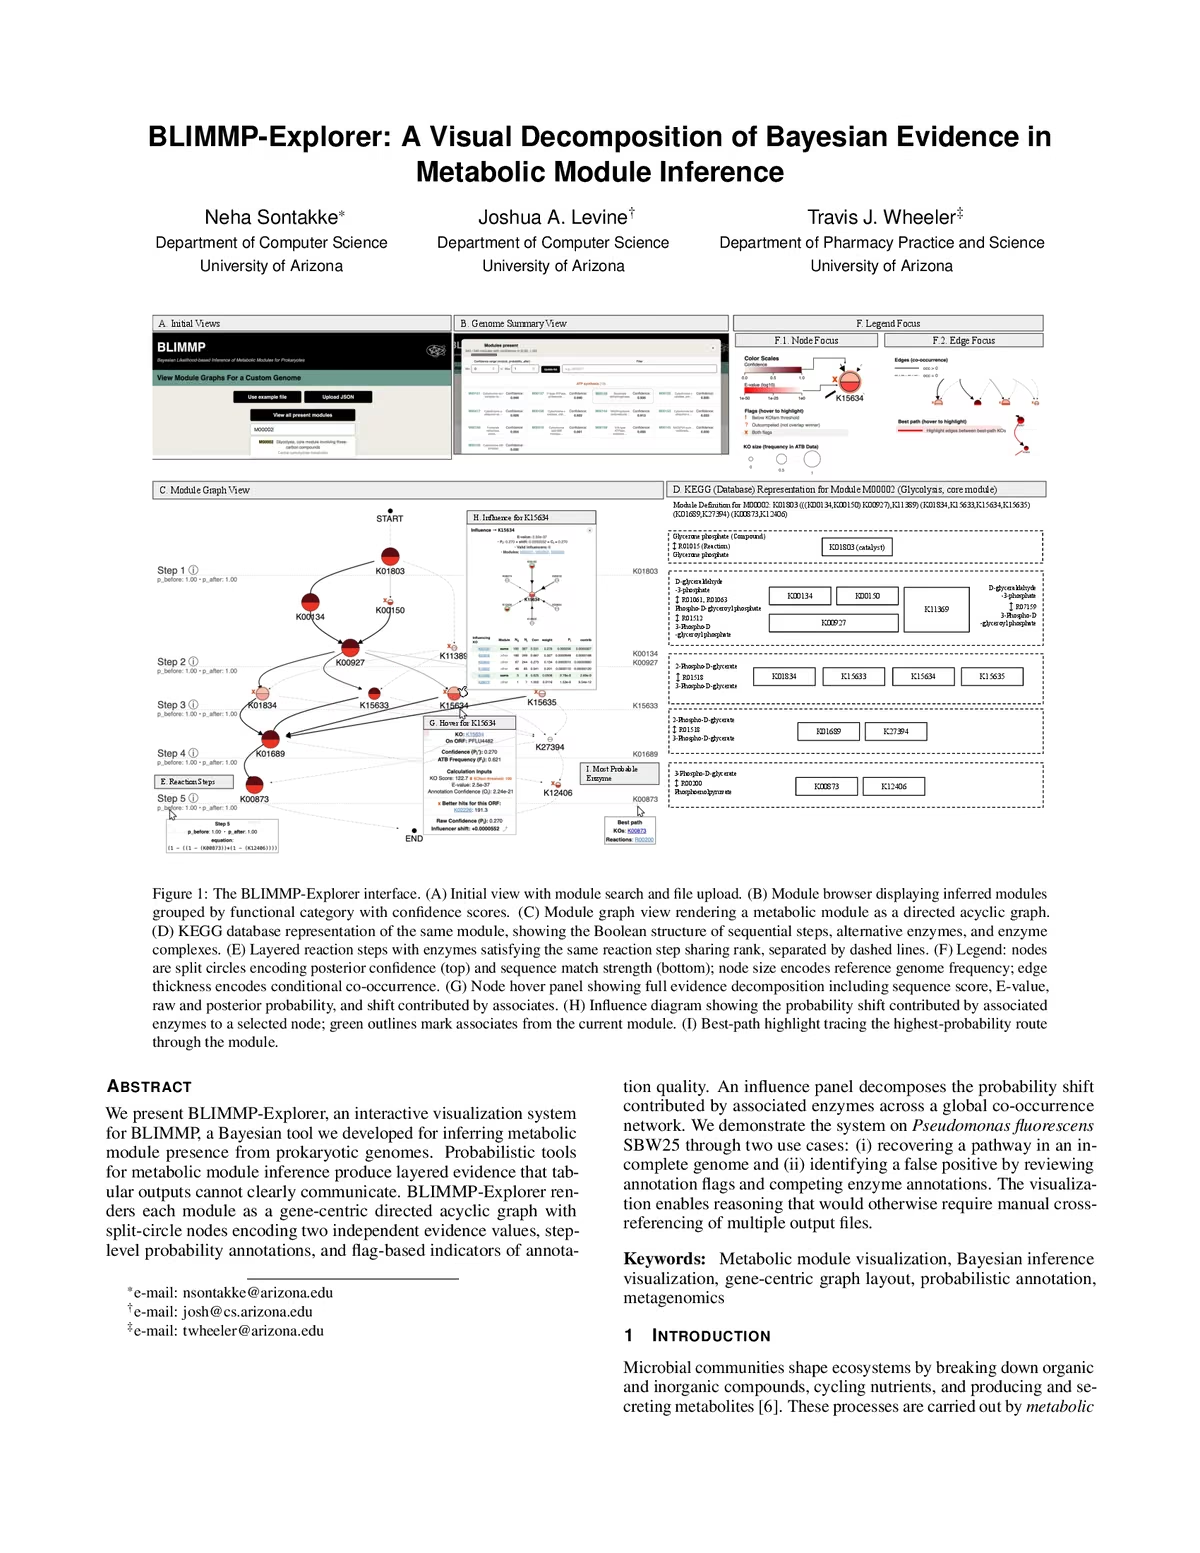
We present BLIMMP-Explorer, an interactive visualization system for BLIMMP, a Bayesian tool we developed for inferring metabolic module presence from prokaryotic genomes. Probabilistic tools for metabolic module inference produce layered evidence that tabular outputs cannot clearly communicate. BLIMMP-Explorer renders each module as a gene-centric directed acyclic graph with split-circle nodes encoding two independent evidence values, step-level probability annotations, and flag-based indicators of annotation quality. An influence panel decomposes the probability shift contributed by associated enzymes across a global co-occurrence network. We demonstrate the system on Pseudomonas fluorescens SBW25 through two use cases: (i) recovering a pathway in an incomplete genome and (ii) identifying a false positive by reviewing annotation flags and competing enzyme annotations. The visualization enables reasoning that would otherwise require manual cross-referencing of multiple output files.
For Practitioners
Practitioners who would find this useful: Biologists interested in visualization and model interpretability. Modelers building interpretable or transparent inference systems, in bioinformatics or elsewhere, who want a working example of decomposing a black-box confidence score into its component evidence sources. Microbiologists, particularly those working with environmental or metagenomic data. How they could apply it: Microbiologists can use the tool directly to audit module calls before relying on them for downstream analysis. Modelers and visualization researchers can borrow the underlying design pattern for interpretable inference tools across other domains.